
Previously we looked at using PowerQuery to manipulate single or multiple data-sets to automate production of a table in the format we are looking for. Today we will deal with a specific situation I’m sure people have come across previously. On any given working day it’s not usual to have multiple sessions from which GPS data has been collected, often these sessions can be run concurrently (i.e. 1st team, U23, Rehab, Conditioning etc) and depending on the GPS system in place you may not be able to separate these sessions into different exports. For our example we will use a situation where we have separate sessions along with individual drills/periods within each session as well. We look at how we can analyse and group these periods into the separate sessions to overcome having them within the same export.
For this method to work, there is an additional step to take before producing the table: we need to add a blank column to the end of the table called “Session”.
Reminder: to add a blank column we simply need to make it equal to 2 empty quotation marks (="")
Now that we have our table loaded up with the blank “Session” column at the end we can start to group the periods together but it can be pretty awkward to scroll to the last column every time so instead we will add a quick group filter:
- Highlight the columns you want to hide regularly
- Select Data tab, select Group (far right of ribbon)
- The numbers 1 & 2 should have appeared just above your first column to the left along with a line above the columns you selected to hide.
- If you now press 1, the columns with be hidden and select 2 to un-hide them
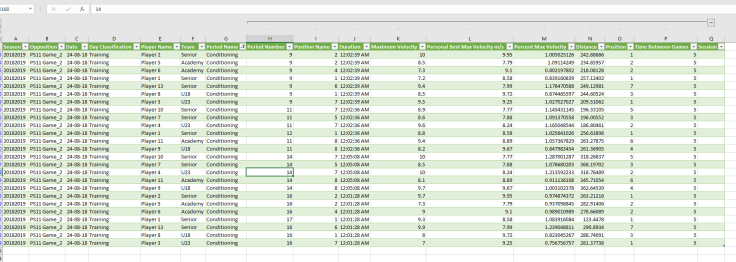
Original Data- set 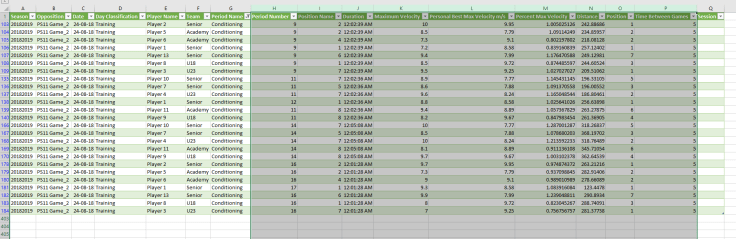
Select Columns 
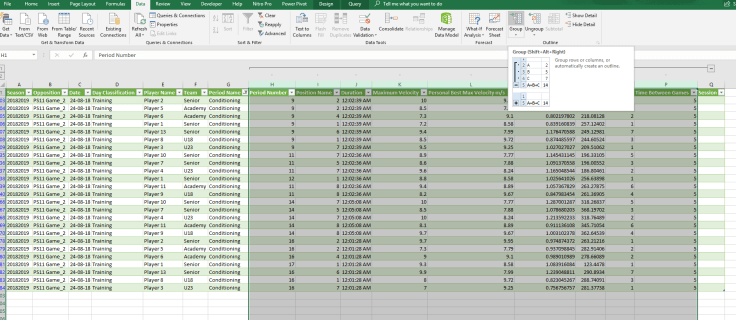
Data Tab –> Group 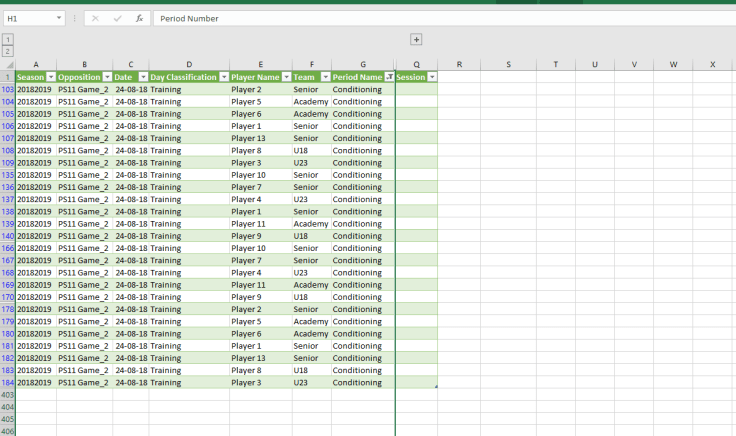
Hidden columns
Now by pressing the 1 at the top left of the table we can hide all the columns we don’t need to view for now.
Next, select the period names you wish group together and for this example lets type
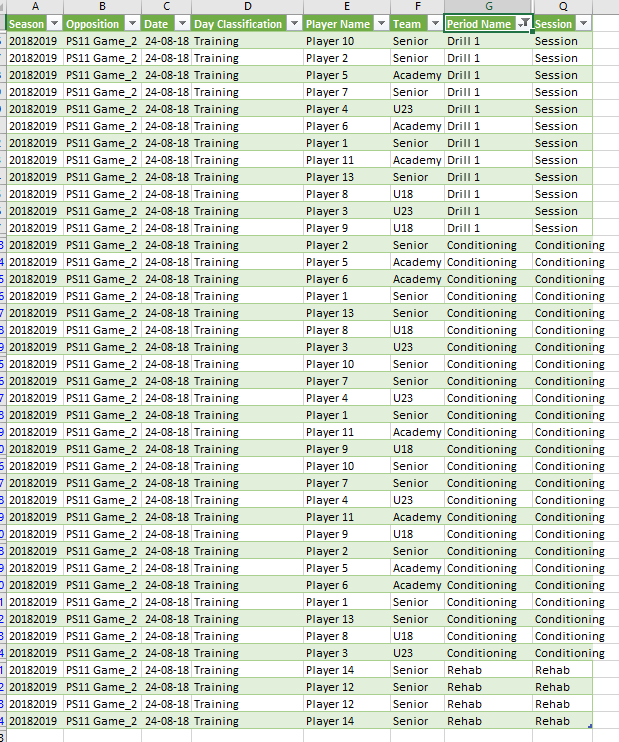
“Session 1” into the Session column. (Quick Excel tip – Select the top cell of Session Column, Ctrl+Shift+Down Arrow will highlight all cells underneath it in the table, type “Session 1”, Ctrl+Enter will then fill in all the highlighted cells)
Repeat above for each separate session, we have 3 session types (Session, Rehab, Conditioning) in our example along with about 30 different periods.
Now we need to add a pivot table (First appearance of pivot tables!!):
Select any cell present on your table
Insert -> Pivot Table -> New Worksheet -> OK
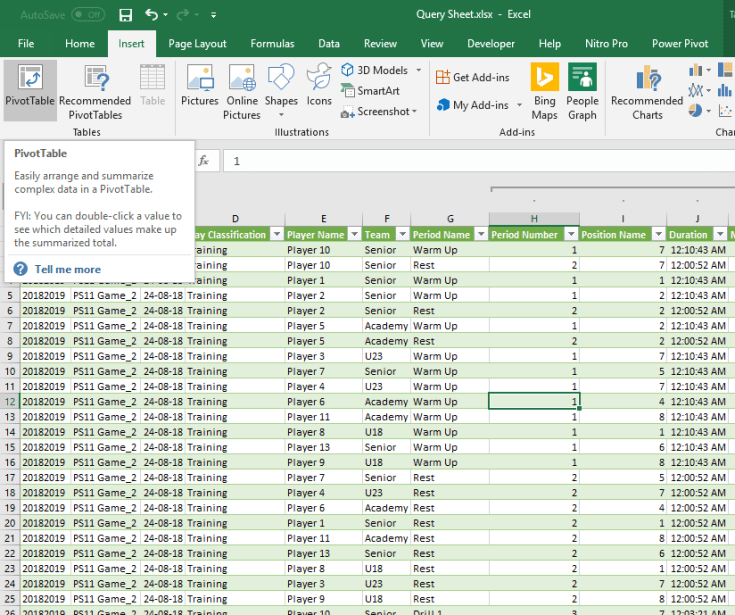
Select Insert –> Pivot Table 
Select OK 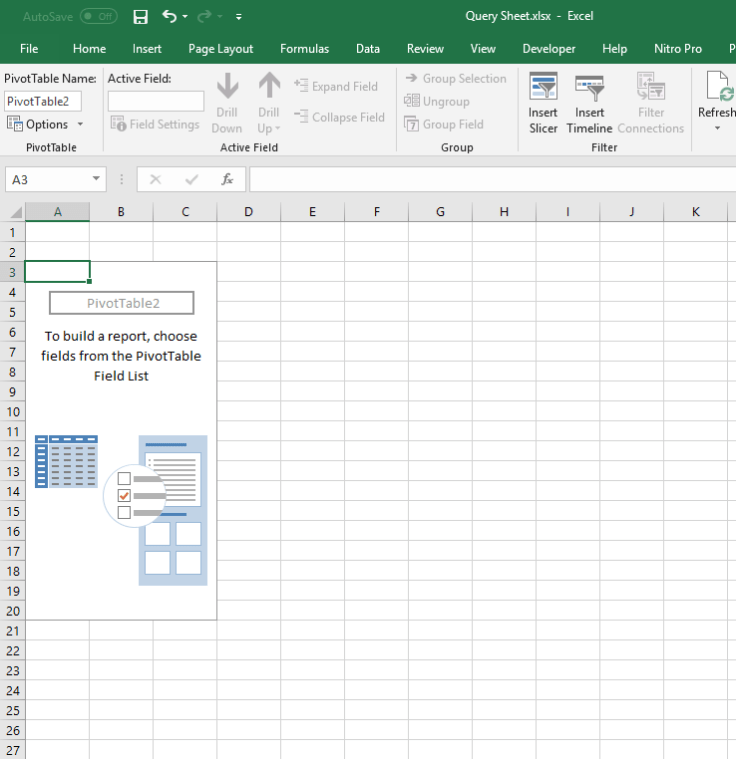
First Pivot Table Started!!
NOTE: WHEN CREATING A PIVOT TABLE FROM A TABLE YOU CAN USE THE TABLES NAME TO REFERENCE ALL OF THE DATA WITHIN SO THE PIVOT TABLE WILL KNOW TO LOOK FOR NEW DATA WHEN IT IS ADDED. THE TABLE NAME CAN BE FOUND BY SELECTING A CELL WITHIN THE TABLE, SELECT TABLE TAB AND THE NAME WILL BE ON THE FAR LEFT OF THE RIBBON THEN
Using the pivot table we will now manipulate the data into the format we want with the goal being to have the ‘Session’ column in place of ‘Period’ column with the relevant data showing the summed/max/average data for the whole session instead of individual periods. Ideally the end format of the pivot table should match the format of the table you have used the Query to produce. By doing so it will allow you to store both sets of data in the same place and further down the line you can start to look at how individual periods affect main sessions or produce drill dictionaries with min/average/max for the different drill types.
First lets set the pivot table up with the goal to have the output the same as the Query output but with data for the whole sessions instead of individual periods:
- All the categories can filled by dragging and dropping them where you want:
- No filters
- No Columns
- Rows – Season, Opposite, Date, Day Classification, Player Name, Team & Session
- Values– Distance, Max Velocity, Date, etc
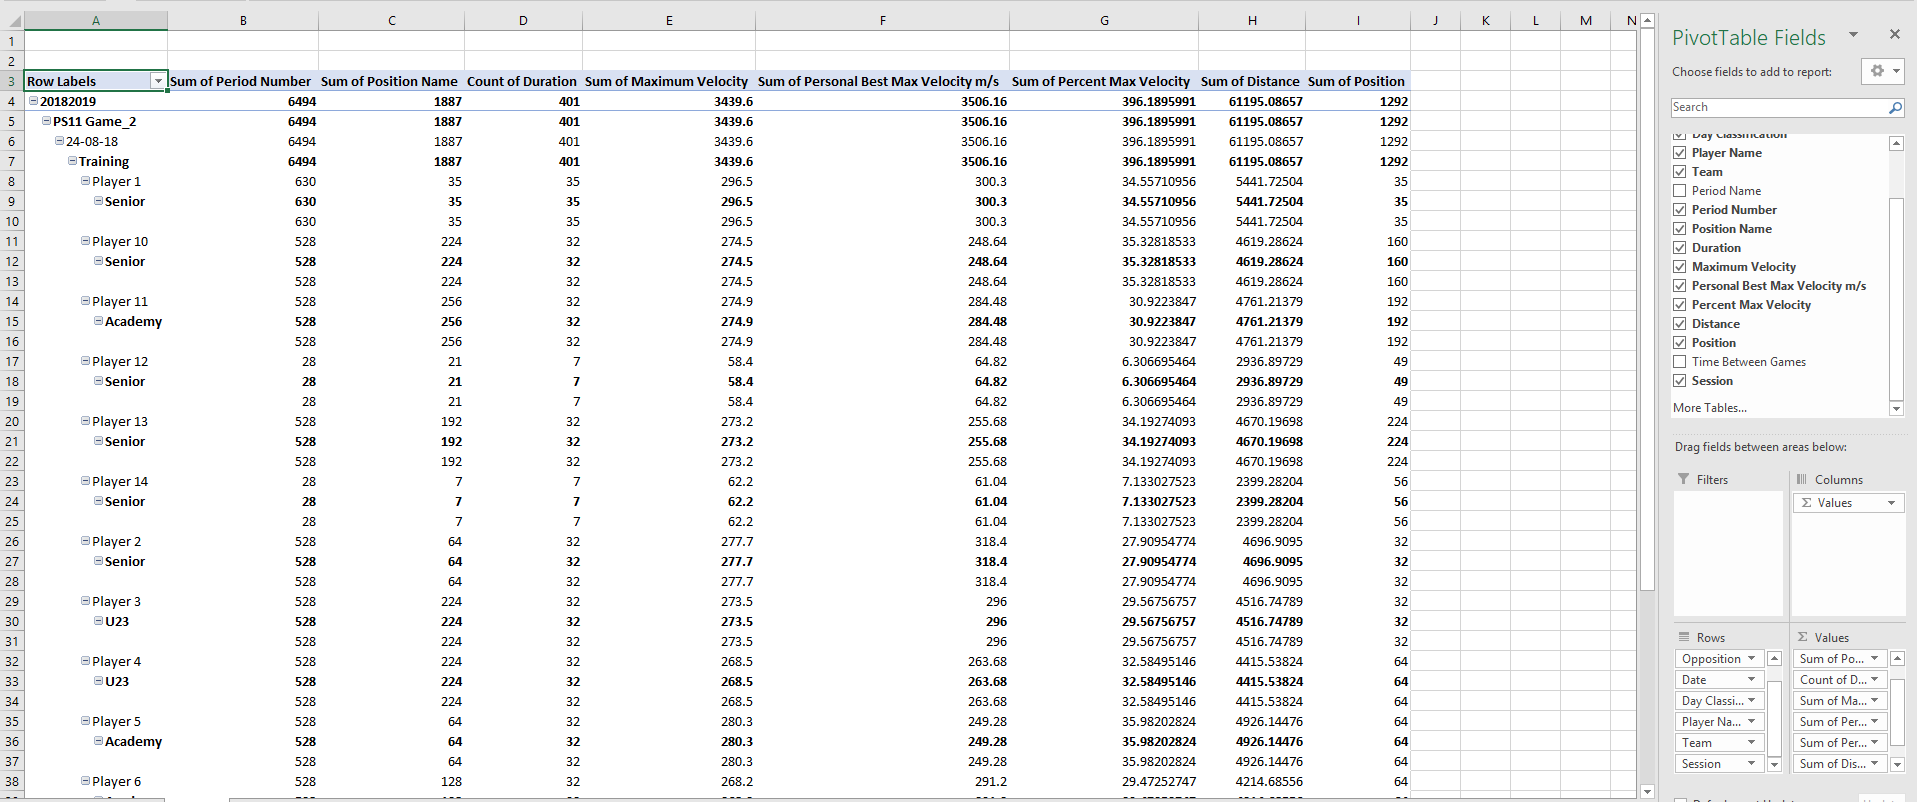
We are now in a place where we nearly have the right information but the formatting and layout of both the pivot table and data within is completely useless! Tune in next time on the same Bat-channel at the same Bat-time to find out the next step (Am I showing my age with that reference?!!).

