
Intro to R Markdown and how to format data tables in R Markdown
How to Create Interactive Reports with RMarkdown Part I:

Intro to R Markdown and how to format data tables in R Markdown

Create heat maps from GPS data using R

First video in a series where we cover R basics

Linear regression to predict training load

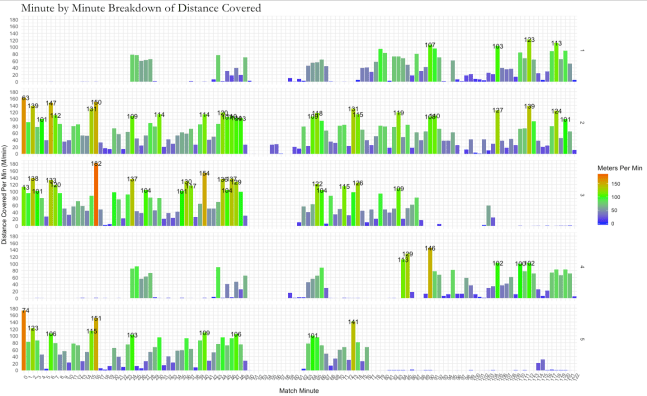
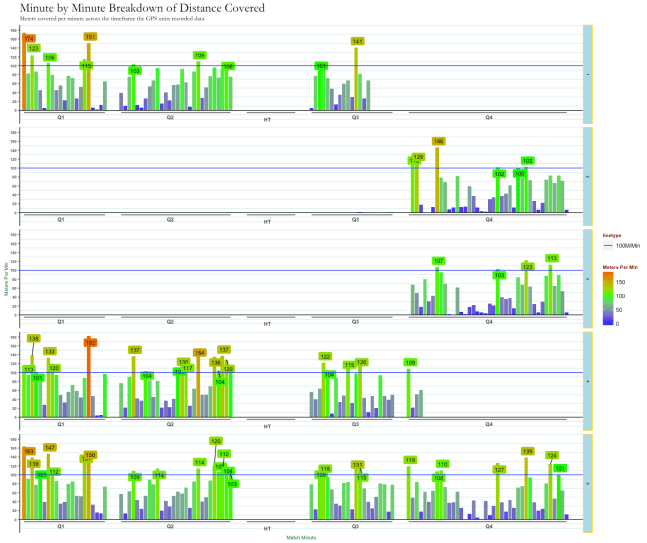
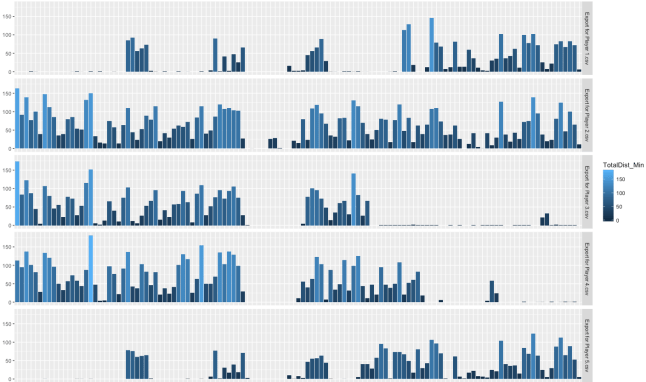
Previously we looked at how to generate a minute by minute profile based off raw GPS data. Today we will go a step further and generate peak period data utilising some of the methods outlined recently on speeding up analysis in r. First, let's go through the difference between the two approaches. A minute by … Continue reading How To Speed Up Analysis in R: Peak Period Data Extraction
Introducing facets to our plots

First look at how to create visuals in R
Introduction to visuals in R (and ggplot)

Adding rolling average data to our raw data analysis
Building in the previous post, here we cover analysing multiple files together.
