
Introduction to visuals in R (and ggplot)
Why Use R(ggplot2) to Create Graphs?
Introduction to visuals in R (and ggplot)

Adding rolling average data to our raw data analysis

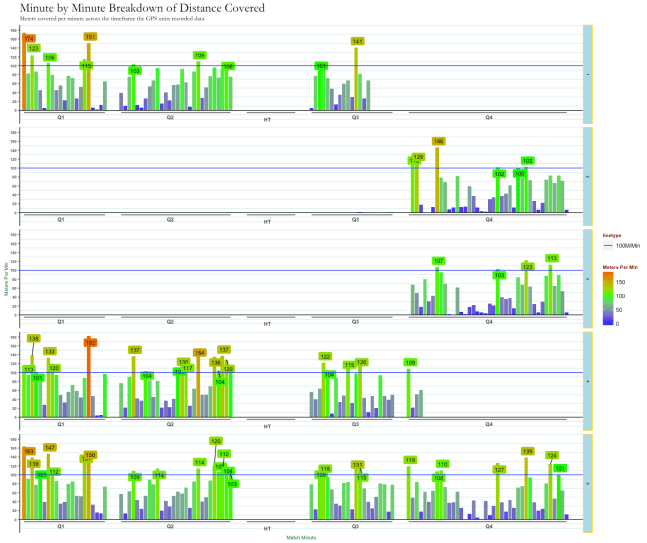
Basic manipulation of 10Htz GPS data to produce a minute by minute breakdown of a session.

How to merge data-sets and filter GPS data to begin looking at Velocity data

Basics around formatting and filtering data in R

How to extract max velocity achieved in a given time-span

Showing how to use power pivot to add percentage of max velocity data
Using pivot tables to produce full session data from individual periods.
