

To date we have looked at how to bring data into R, pull some basic info about your data, formatting your data and finally a small bit around filtering your data. Today we will look at how to merge different dataframes and finally start a small bit around our velocity analysis.
First we must load in our file with all the player information in it, similar to how we loaded in our GPS data:
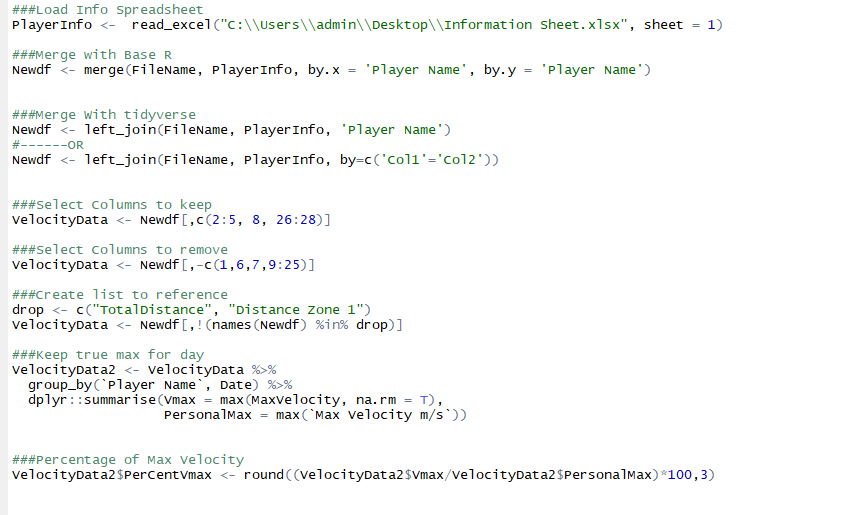
PlayerInfo <- read_excel("C:\\Users\\admin\\Desktop\\Information Sheet.xlsx", sheet = 1)- Remembering to use to use the
sheet=function at the end to specify the correct sheet (different filename format for mac)
- Remembering to use to use the
Next we will look at 2 ways to merge the files, using base r and using tidyverse. In order to merge dataframe we must have at least one column in each with identical values.
- Base R
Newdf <- merge(FileName, PlayerInfo, by.x = 'Player Name', by.y = 'Player Name')- First we specify the dataframes we wish to merge then we specify which columns are the same in both.
by.xspecifies the column from the first andby.yis the second dataframe then.
- tidyverse
Newdf <- left_join(FileName, PlayerInfo, 'Player Name')- Begins similar to
base r, however as the column name is the same in both we only need to type it once. If the columns we wished to join by had different names it would look like this: Newdf <- left_join(FileName, PlayerInfo, by=c('Col1'='Col2'))- We have a number of options about how to join using tidyverse, see here

The new dataframe with the merged data should appear in your RStudio now with the Player Info data on the far right of the dataframe.
For our example we will look in more detail at the velocity data so the 1st step is to remove all the columns we don’t want present. We have a few options when it comes to performing this action:
- Select columns to keep
VelocityData <- Newdf[,c(2:5, 8, 26:28)]- Initial
,is saying we aren’t filtering by rows,cis saying we want to make a list of columns to reference.2:5&26:28is all columns from 2 – 5 & 26-28 inclusive,8is column 8. You can see what a columns number is by hovering over the column header in the dataframe.
- Initial
- Select columns to remove
- VelocityData <- Newdf[,-c(1,6,7,9:25)]
-
-cindicates the columns are to be removed
-
- Create a list of column names to drop
drop <- c("TotalDistance", "Distance Zone 1")- Create list called
dropwith the columnsTotalDistance&Distance Zone 1in it.
- Create list called
-
VelocityData <- Newdf[,!(names(Newdf) %in% drop)]- In this method, the function
names returns all column names in theNewdfdataframe and the!is saying to remove those in the listdrop. This method can be quite time consuming however can be useful if you are in a position where the column positions or column names change regularly.
- In this method, the function
- See here for more info and methods on subsetting your dataframe

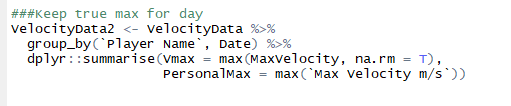
We have one more step to take before we look at our data. While not a regular occurrence, if players perform more than one session in a day and we have two sets of max velocity data we might only want to look at their true max for that day. We will do this using the group_by and summarise functions from the dplyr function along with piping.
VelocityData2 <- VelocityData %>%
 group_by(`Player Name`, Date) %>%
 dplyr::summarise(Vmax = max(MaxVelocity, na.rm = T),
 PersonalMax = max(`Max Velocity m/s`))
- 1st line: create dataframe called VelocityData2 from VelocityData.
- 2nd line: to group by the data 1st and then player name
- 3rd line: extract the max velocity for each individual player for every date recorded along with their own personal max recorded velocity.
na.rmis saying to ignore any dates where an individual doesn’t have any data rather that returnedna.- I have used
dplyr::summariseas a number of packages have summarise functions which can work differently, usingdplyr::means I am specifically looking for thedplyrversion of summarise.
Now we should have a dataframe with 4 columns: date; player name; daily max velocity data and personal max velocities. We can finally produce some more usable data on our velocities.
- Percentage Max Velocity
VelocityData2$PerCentVmax <- round((VelocityData2$Vmax/VelocityData2$PersonalMax)*100,3)
That’s our lot for today, next we look at how we add in data to do with time since 90%+ velocities and then use a package called data.table to make our data more interactive and colour coded.
