
Intro to R Markdown and how to format data tables in R Markdown
How to Create Interactive Reports with RMarkdown Part I:

Intro to R Markdown and how to format data tables in R Markdown

Create heat maps from GPS data using R

Linear regression to predict training load

Previously we looked at how to generate a minute by minute profile based off raw GPS data. Today we will go a step further and generate peak period data utilising some of the methods outlined recently on speeding up analysis in r. First, let's go through the difference between the two approaches. A minute by … Continue reading How To Speed Up Analysis in R: Peak Period Data Extraction
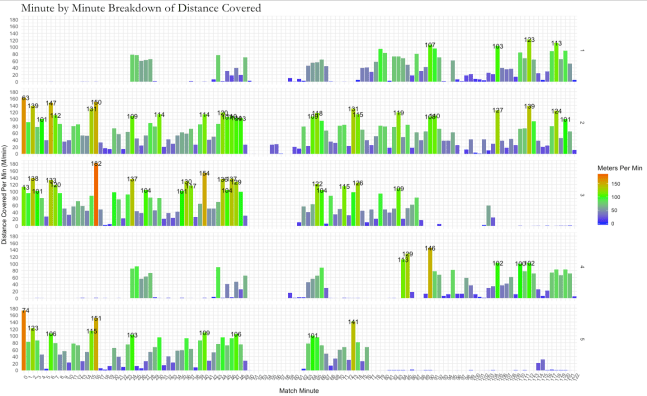
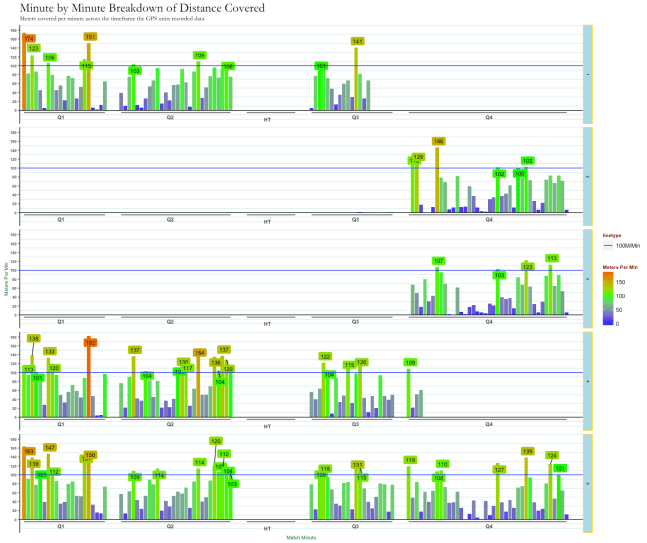
Introducing facets to our plots

First look at how to create visuals in R
Introduction to visuals in R (and ggplot)

Adding rolling average data to our raw data analysis
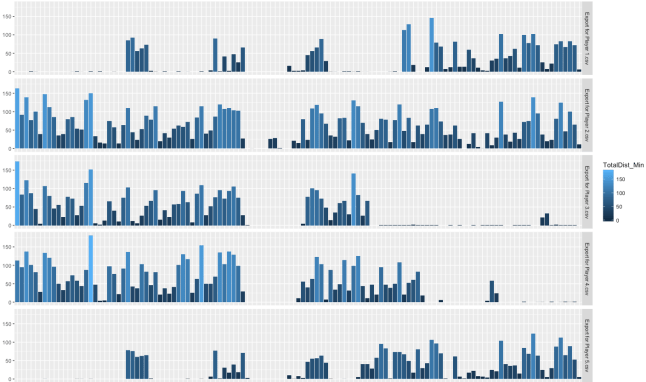
Building in the previous post, here we cover analysing multiple files together.

Basic manipulation of 10Htz GPS data to produce a minute by minute breakdown of a session.
