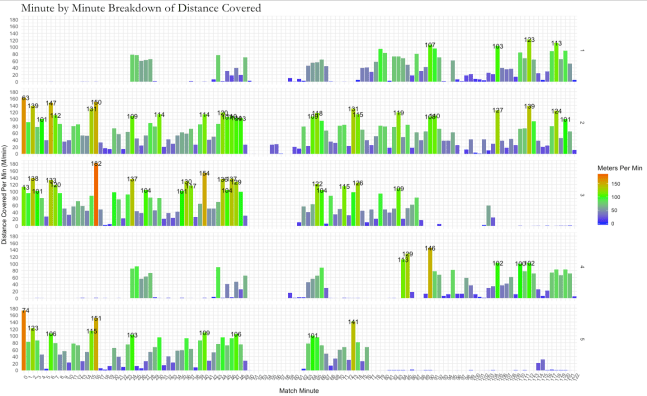
Visuals With R: Multiple Plots Posted on 13th Nov 201830th Jan 2019 by SportSciData Introducing facets to our plots
Visuals in R: Minute by Minute GPS Data Posted on 10th Nov 201830th Jan 2019 by SportSciData First look at how to create visuals in R