
Intro to R Markdown and how to format data tables in R Markdown
How to Create Interactive Reports with RMarkdown Part I:

Intro to R Markdown and how to format data tables in R Markdown

Using PowerBI to report our data

Analysing and Reporting on HRV data using RMarkdown
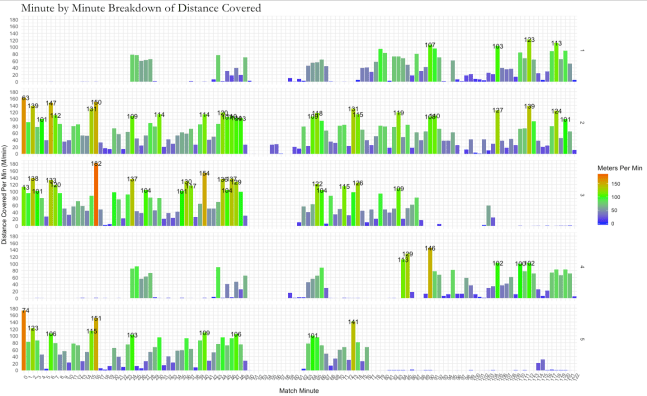
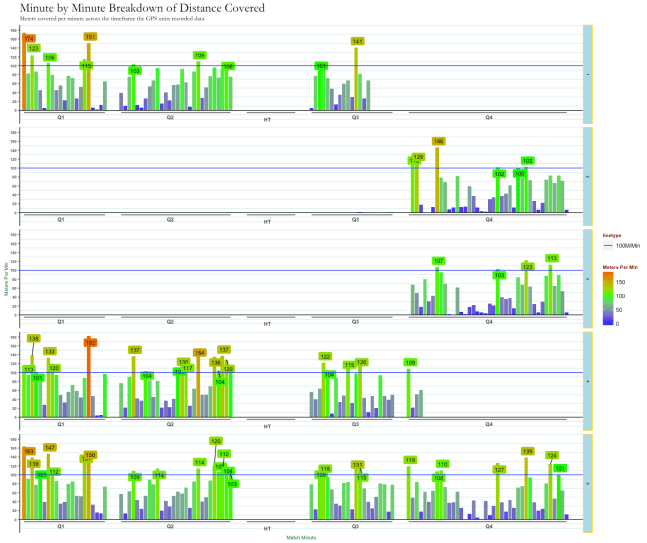
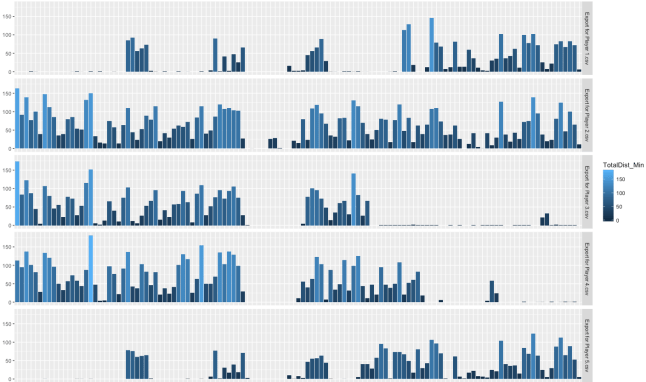
Introducing facets to our plots
Introduction to visuals in R (and ggplot)

Adding rolling average data to our raw data analysis
Building in the previous post, here we cover analysing multiple files together.

Basic manipulation of 10Htz GPS data to produce a minute by minute breakdown of a session.

How to merge data-sets and filter GPS data to begin looking at Velocity data

Basics around formatting and filtering data in R
