
Part 2 of our investigation into HRV through markdown
Analysing and Reporting HRV Data in RMarkdown P2

Part 2 of our investigation into HRV through markdown

Analysing and Reporting on HRV data using RMarkdown
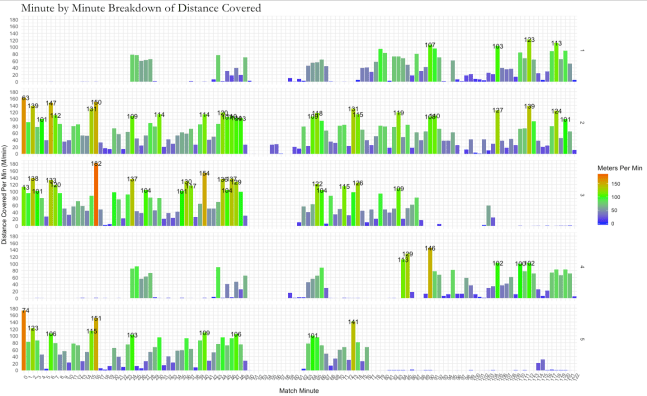
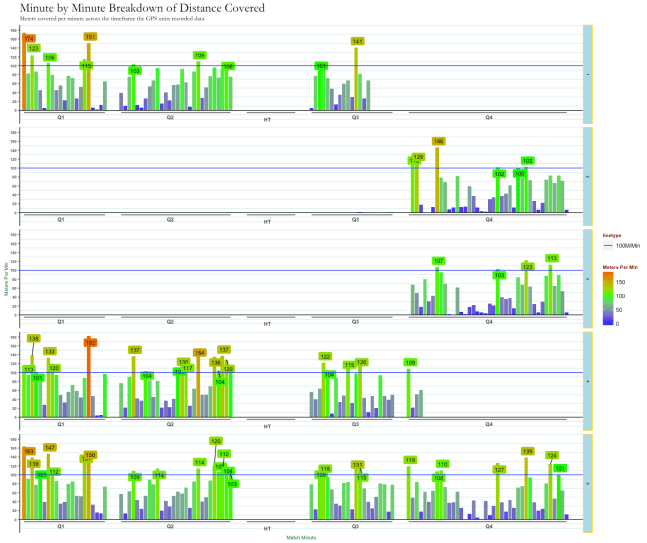
Introducing facets to our plots

First look at how to create visuals in R

General thoughts on issues surrounding data in sport
Introduction to visuals in R (and ggplot)

Adding rolling average data to our raw data analysis
