In the last post I covered generating a minute by minute profile from a raw gps export, today I’m going to add a small bit to that script that will allow us to include rolling averages of various windows along with the minute by minute profile. The goal here is to start building a bank of data so eventually we can produce the popular ‘Worst Case Scenario‘ profile.
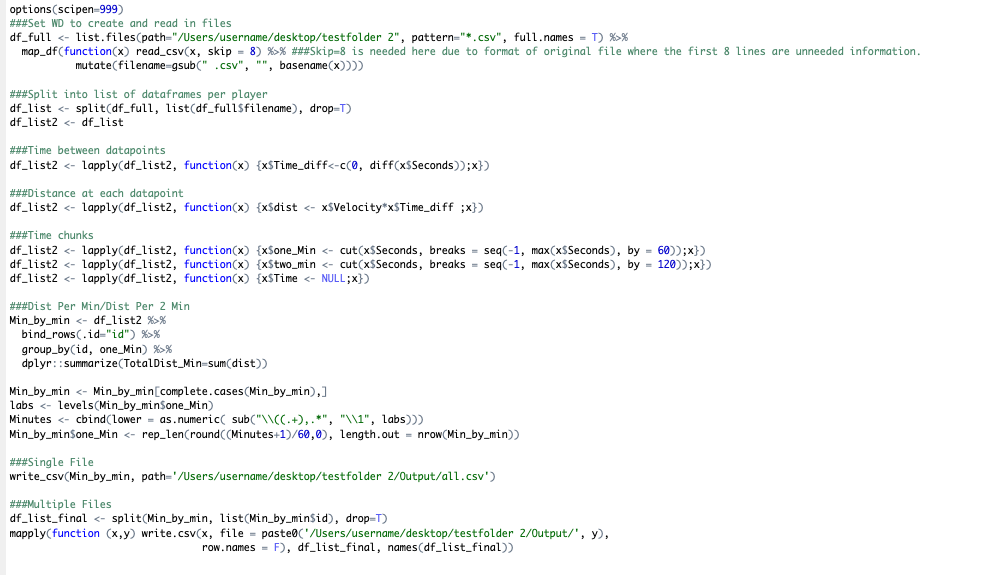
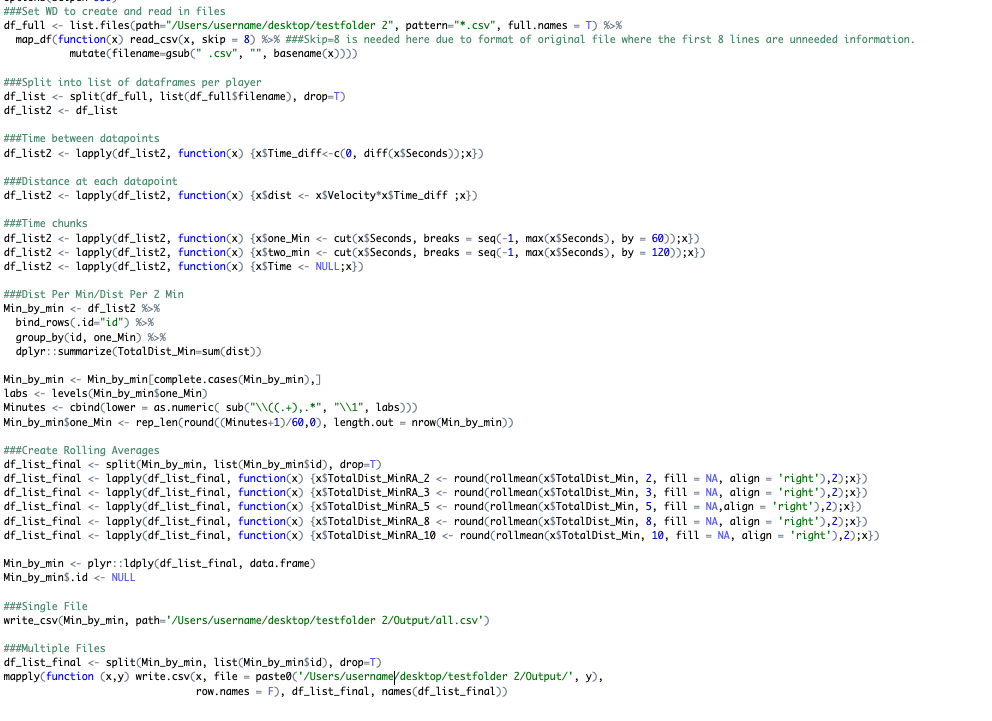
This is the script as we left it last time round (note: lines 38-40 will take the time metric produced from the cut function and change it to a minute number).
To add our rolling averages we will create some space after line 40. The process here will start to seem familiar to previous work as we will again split the data into a list of data frames and then use the lapply function to work through each dataframe with the zoo::rollmean function. This process could be carried out using dplyr::group_by and dplyr::mutate which removes the need to split the data into a list however I find using the list and lapply method a better approach as it guarantees one players data won’t affect another.
Split whole dataframe into list of dataframes split by players:
df_list_final <- split(Min_by_min, list(Min_by_min$id), drop=T)
Create two minute rolling average:
df_list_final<-lapply(df_list_final,function(x{x$TotalDist_MinRA_2<-round(rollmean(x$TotalDist_Min,2,fill=NA, align='right'),2);x})rollmeanfunction,2specifies window length (i.e number of rows),fillspecifies any empty rows created (due to the rolling window having less data than the column its based off) to be filled with NA, align determines window offset, i.e. before, same as or after current point. Theroundfunction keeps the data at two decimal points to avoid the need to round later.
Rinse and repeat for desired window lengths:
df_list_final<-lapply(df_list_final,function(x){x$TotalDist_MinRA_3<-round(rollmean(x$TotalDist_Min,3,fill=NA,align = 'right'),2);x})df_list_final<-lapply(df_list_final,function(x){x$TotalDist_MinRA_5<-round(rollmean(x$TotalDist_Min,5,fill=NA,align='right'),2);x})df_list_final<-lapply(df_list_final,function(x){x$TotalDist_MinRA_8<-round(rollmean(x$TotalDist_Min,8,fill=NA,align='right'),2);x})df_list_final<-lapply(df_list_final,function(x){x$TotalDist_MinRA_10<-round(rollmean(x$TotalDist_Min,10,fill=NA,align='right'),2);x})
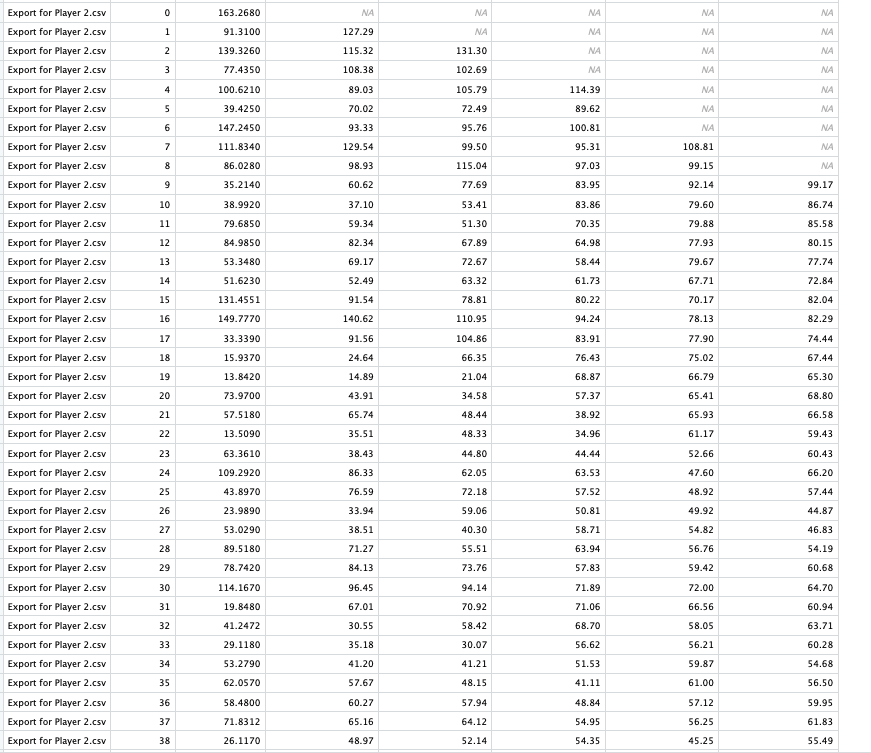
Now we have rolling averages for windows of 2/3/5/8/10 minutes.
Next we can either keep the data in list format and write multiple csv files (covered previously) or pull together into a single dataframe and write a single csv.
To create to a single dataframe:
df_test <- plyr::ldply(df_list_final, data.frame)- This may replicate a column within the dataframe.