
Building in the previous post, here we cover analysing multiple files together.
How To Produce Minute By Minute Data From 10Hz Data – Multiple Files
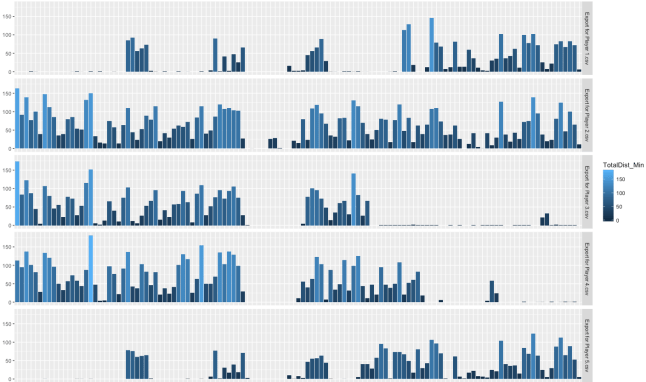
Building in the previous post, here we cover analysing multiple files together.

Basic manipulation of 10Htz GPS data to produce a minute by minute breakdown of a session.
Creating days since max velocity and colour coding

How to merge data-sets and filter GPS data to begin looking at Velocity data

Basics around formatting and filtering data in R

Introducing RStudio environment and bringing your data into R

Previously we arranged our data to look at the max velocity reached over the last 12 days. This may give us an indication of maximum velocity reached recently but we also need an indication of how many exposures at or near max velocity an athlete has had. There is likely to be a quicker way … Continue reading Using PowerPivot To Analyse Velocity Data: 2
Introduction to the R programming language and what's possible with it.

How to extract max velocity achieved in a given time-span

Explaining ranges and named ranges in Excel
