

Previously we covered how to assess percentage of max velocity reached within a session. On its own this information is of limited value, where it’s true value lies is in how often near max velocities are reached. Both from an injury prevention and from a retention of physical quality perspective, hitting high velocities is important. However it’s not always the easiest to keep track of. We could go down the route of visual analysis and dummy variables, or a messy formula pulling from a table of data but why not look at keeping all the complicated workings in the background so we can just look at one single number?
It’s not possible I hear you say! Madness even! Having previously set it up where we can see what percentage of max velocity an individual reached on any given day, next we need process of finding some way to count the number of exposures. Dependant on your environment what time-span you choose to keep track off is your call, personally I think about 12-14 days is a good choice. Long enough to allow multiple exposures, usually would include at least one game plus a number of training sessions and also short enough to help prevent any loss of ability.
We need to add a few bits to our data in power pivot before we can start to dig into the numbers a bit more! First lets look at adding the highest velocity reached in the past 12 days. To do so we have to find a way to isolate a time-span and then extract the max velocity from that time-span. Extracting the max velocity is something we looked at previously but isolating a time-span is new. Luckily power pivot has a reasonably simple function to allow us to perform this action “DATESINPERIOD“. Using this we can isolate the start and end of our time-span. Our start will be the most recent date we have data for and the end will be the start minus 12 days. So it will look something like this:
- DATESINPERIOD(‘GPS Raw Data'[Date],LASTDATE(‘GPS Raw Data'[Date]),-12,Day))
The “LASTDATE” function goes to the most recent date, then 12 days beforehand and uses that to filter our data. Now we have to wrap the above formula in one which will then look at the max velocity column also which leads us to this
- 12DayVmax:=CALCULATE(max(‘GPSData'[MaxVelocity]),DATESINPERIOD(‘GPSData'[Date],LASTDATE(‘GPSData'[Date]),-12,Day))
NOTE: The above formula is entered into the calculation area.
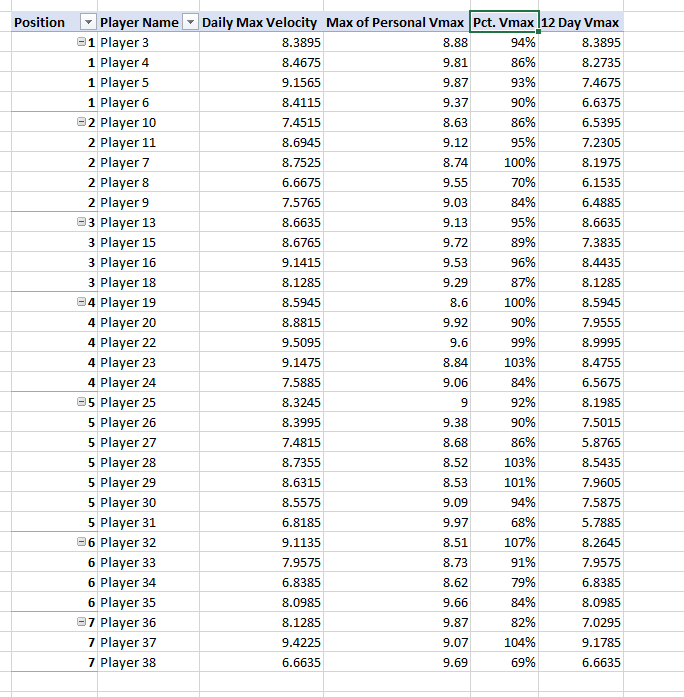
Now if we go back to the pivot table we have been building we should now be able to add in the 12DayVmax column at the end of our table. If you wish using the method outlined previously we can also have this as a percentage.
Now that we have all the ingredients in place, next we will look at how we can use the above to produce number of exposures above a certain percentage within a given time-span! Slowly starting to go places here!
