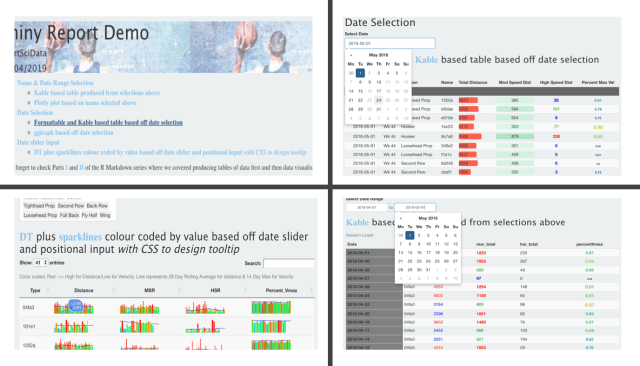
In our last post we looked at how we can use R Markdown to produce tables of data ending in this report. This included grouping data, conditional formatting along with adding design features to improve the overall athletics and usability of the table. Now we will cover another method of showing data within R Markdown: … Continue reading How to Create Interactive Reports in R Markdown Part II: Data Visualisation
How to Create Interactive Reports in R Markdown Part II: Data Visualisation