

Following on from Mathieu Lacombes article where he looked at extracting peak period data and found it to be a potentially long process for a large number of files, I thought I would try to put together ideas for how to speed up analysis. First we will look at some of the options available to speed up analysis in R and then in the next blog, I will go through a method that extracts peak period data, similar to Mathieu, but can work through approximately 400 GPS data exports in under ten minutes.
For the majority of the work we would carry out day-to-day, this may not be necessary however once we get into looking an longitudinal data, 10Hz GPS or 1000Hz+ accelerometer/force platform data it can quickly stack up and lead to long waits for data to be analysed.
Before we go into the different approaches, I feel its worth mentioning that R has numerous ways of achieving the same outcome and which method works best depends on a number of factors including:
- Type of data
- eg files originating from .csv tend to be quicker to work with than .xlsx
- File size or amount of data
- In the world of R, roughly speaking small files are less than 1,000,000 rows (<2gb), medium upto 4gb and large are over 4gb
- Computer/laptop specification
- User experience with R and programming in general
Timing Script
There’s a number of ways to look at timing how long a script or part of a script takes in R, this article looks at a number of those. For ease of use, I tend to go with the sys.time() or the tictoc package. sys.time can be useful when wanting quickly look at timing however tictoc can be easier to use if you have multiple timings as you can quickly name and carry out nested timings with the times available to view at the end.
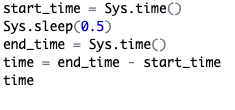
sys.time approach 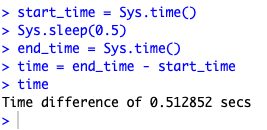
sys.time output 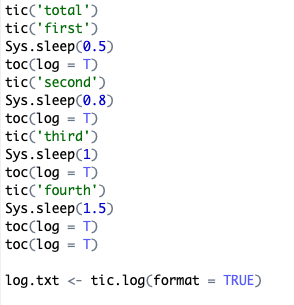
nested tictoc 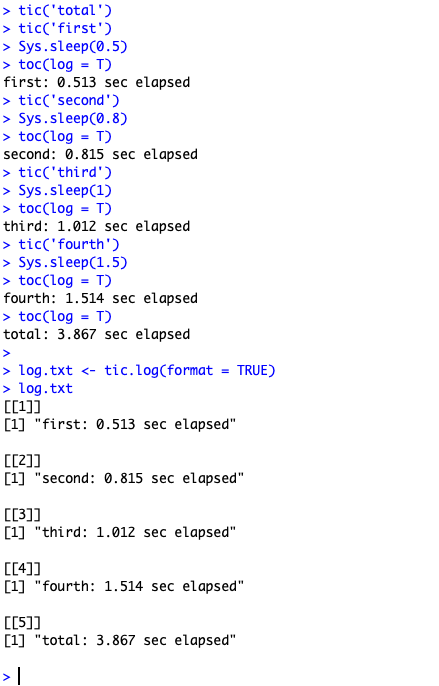
tictoc output
Ways to Speed Up Analysis
Before I start, I want to reiterate, while the methods listed may speed up the analysis on the data I’m using, it may not speed up your analysis. I would suggest once you are happy that your script works correctly, start to look at areas where you feel it could be quicker and carry out some timings.
Restart your r Session
Let’s start with a simple one. If you have been working in r for a while and ran through different analysis or different versions of your r script without exiting RStudio at all, it can be worth restarting your session at timely intervals. Similar to the unnecessarily technical sounding power cycling this will reset r and remove anything leftover from old analyses that may be slowing things down. CMD/CTRL+SHIFT+F10 will easily perform the restart or from the Session tab along the top of the screen.
dplyr/tidyverse Approach
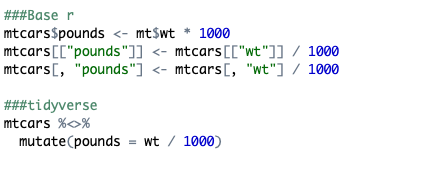
For those not already familiar with the tidyverse family of packages, I would suggest having a look at the related courses on DataCamp. In short, the packages aim to speed up analysis analysis by all having a similar syntax and having functions which can quickly be used with your data. Below is an example with three methods of creating a new columns using base r and a single method using the tidyverse. As someone who learned bits of both initially, I find the tidyverse approach much easier to grasp than many base r approaches.
This I find to be particularly true the more in depth your analysis tends to be. Here is an example where we first change one column then create a new column based off values in the one we altered compared to a number of lists. Base r uses a nested ifelse statement while dplyr::case_when performs the same task in the tidyverse approach. In terms of ease of use, I think tidyverse comes out on top here anyway.

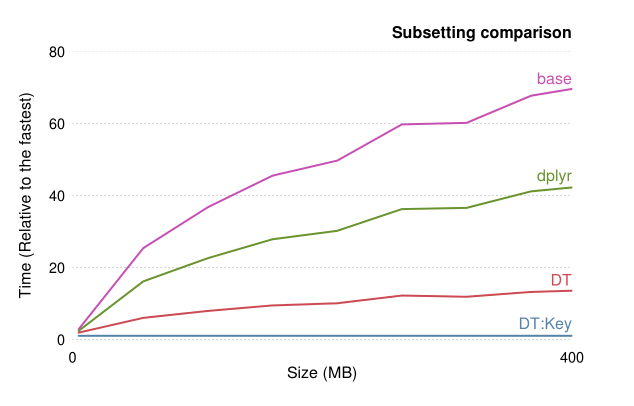
However, tidyverse approaches aren’t always the quickest when dealing with large amounts of data. If you have 2gb+ or over 1,000,000 rows worth of data, it can be worthwhile looking into data.table approaches.
data.table Approach
The data.table package in r is one which is designed for speed of analysis particularly when dealing with large groups. However, unlike the tidyverse approach which can be understood with relative ease, the syntax of data.table is much harder to grasp (still very much working my way through it!). Rather than speak about it myself as it is situation specific, I will provide some links to further reading on it.

- This question on SO specifically deals with comparing
data.tableanddplyr - Nice blog comparing
dplyr,data.tableandbase r - For the more tech savvy people, the main author of
data.tablehas written about the comparisons also here - Finally, here’s a general introduction to
data.table
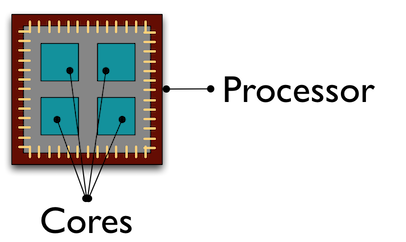
Parallelisation
Here is another area I have had limited dealings with through the parallel package. Without script stating otherwise, rwill opt to use a single core on your processor to carry out work which isn’t always the most efficient approach if you have a large dataset. Parallel computing is spreading the work across all cores on your processor which can reduce the overall time taken. This blog goes into using parallel computing in r in much more detail than I am capable of. For my use it has only stretched as far as using the parallel::mclappy in place of lapplyhowever there was a noticeable decrease in the time taken for the function in question. See here for further reading.
Use Custom Functions
r processes script in a line-by-line approach so the longer the script, the more likely it is to take longer. We can reduce this by creating custom functions ourselves and calling upon them in the analysis which in turn can shorten our analysis. However its should be noted this an area worth carrying out some timing investigating as not all functions are quicker if grouped together. This blog outlines how to create functions whereas this covers storing functions that are used frequently across multiple scripts.
Rccp package (C++)
Finally, the last but potentially most effective method is through the Rcpp package. This package allows you to incorporate the C++ language into r scripts to create functions which can then be called upon.. Admittedly this is an area I know very little about but do have an extremely effective example of it in the next blog.
Sample R script using above methods outlined here
