Previously we look at how to merge datasets and the subset our data to only include velocity based data, finally we produced our percentage of max velocity column. Today we will look at when and how long it has been since a player hit a high velocity. We will do this by first creating a column which gives the date of a players last 90% or higher and then how long it has been since that date.
- Last 90% or higher date
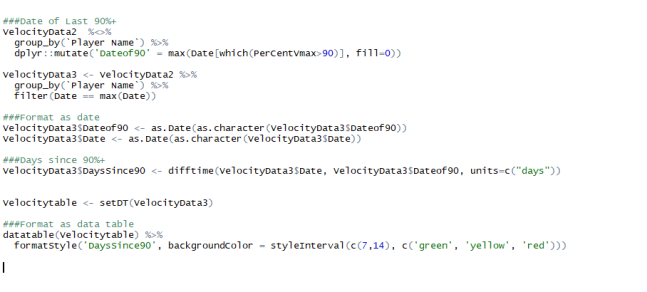
VelocityData2 %<>% group_by(`Player Name`) %>%
dplyr::mutate('Dateof90' = max(Date[which(PerCentVmax>90)], fill=0))- To note: Grouping by player name means we return a date for each individual player. Using
dplyr::specifies mutate from the dplyr package. Then we are saying return a column called'Dateof90‘ which is equal to the last date a player hit a value of 90 or higher. Thefill=0means if a player has not hit 90% within the data it will return 0.
- Next we will subset our data to only have one row of information per player which is the most recent data:
VelocityData3 <- VelocityData2 %>%group_by(`Player Name`) %>%
filter(Date == max(Date))
- Finally we will include a column that calculates the difference between the date of the players last 90 and the most recent data available:
VelocityData3$DaysSince90 <- difftime(VelocityData3$Date, VelocityData3$Dateof90, units=c("days"))- The
difftimefunction looks at the difference between the 2 dates andunits=("days")is returning an answer as the number of the days - NOTE: You may need to format both the date and dateof90 column as a date for the difftime formula:
-
VelocityData3$Dateof90 <- as.Date(as.character(VelocityData3$Dateof90))
VelocityData3$Date <- as.Date(as.character(VelocityData3$Date))
-

Now can start apply some colour coding through the DT package.
First we must format our data as a data table:
Velocitytable <- setDT(VelocityData3)
The we can apply some formatting to our datatable
datatable(Velocitytable) %>%
formatStyle('DaysSince90', backgroundColor = styleInterval(c(7,14), c('green', 'yellow', 'red')))- To note: within formatstyle we are specifying the DaysSince90 columns and although only 2 numbers referenced, the style interval is looking at the intervals as “min value-7, 8-14, 15-max value ” and then applying the colours to those ranges

That’s it for today, next we will go through some of the further options available to us through the DT package about how we can shape a datatable.