
Last time out we looked at creating a pivot table from files loaded into PowerPivot in addition to bringing data from one file to another. Today we will look at how to add to our velocity monitoring system by including a percentage of max velocity column which can be added through PowerPivot also. I can hear you thinking why not just add a column into excel with a quick formula in it. Well anyone who has worked in a table with lots of formulas knows the pain that disrupting those formulas can cause in addition to the time it can take to set them up in the first place! This will allow us to update and change the pivot table how and when we see fit without affecting the formulas. Remember, the goal here is to automate and reduce time in Excel!
Hopefully you managed to create the pivot table with the data showing in all the right places similar to the image below:
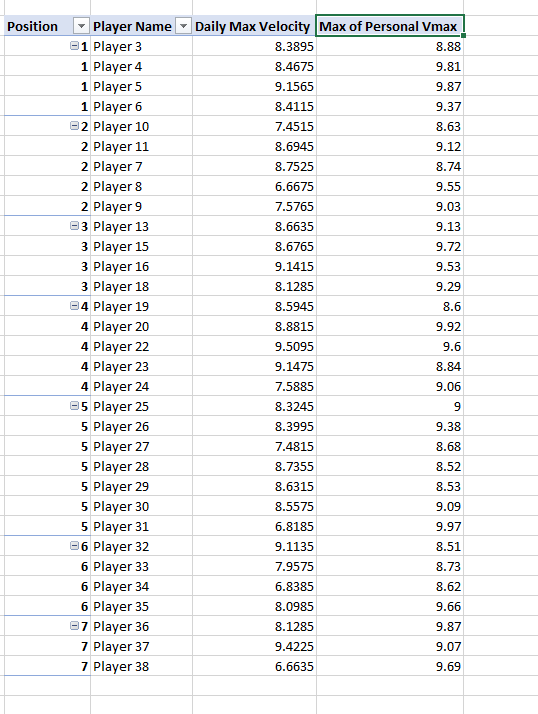
If you are not aware, we can group data based off the "Row" values in a pivot table. Above I have grouped by Position then Athlete Name. This is due to the order they appear in the "Row" box for the pivot table formatting where it is "Position" then "Athlete Name"
Next we want to to add a percentage max velocity column to the data:
- Back we go to our PowerPivot window
- Now we are going to work in the “Calculation Area” which should be underneath your data table, if not select it at the far right on the top ribbon
- To work here, it’s easiest to have any data we use referenced already within the calculation area or in a calculated column.
- Lets create a “Daily Vmax” cell first:
- Select any cell in the calculation area
- Daily Vmax:=MAX(‘GPS Raw Data'[Max Velocity])
- We can reference our personal Vmax as we created it previously
- Now we can create the percentage Vmax
- Pct. Vmax:=DIVIDE([Daily Vmax], [Max of Personal Vmax]
- Once you type the first ‘[‘, options as to what you can use should start to appear!
- Now that we have created the data, you should be able to refresh your pivot table and put the Pct. Vmax data in as well. The you just need to format the data as a percentage (double click on column header)

Hopefully you have ended with something similar to above and it wasn’t as painful as you thought at the start? Next we will look to add a way of keeping track of the number of exposures at or near max velocity recently.
