
Yesterday we looked at loading data into PowerPivot and a small bit around data manipulation as well. Today we look at creating links between the files we loaded so when we later produce pivot tables drawing from multiple tables, it will be aware what where the links between files are. This will let us combine different sets of data together to produce one table or report.
To create these connections first we need to open the PowerPivot window as we did previously:
- Select Diagram view from the top ribbon, you should now have a window with the different table names and columns listed underneath. You can move the tables around the window by click, hold and drag on the table header.
- To create a connection simply click and drag the common column from one to the other.
- In our example, we drag “Player Name” from the player information table to both the GPS and the HR table
- We do the same with the “Date” column from season structure.
In order to create a connection, the data can only be replicated in one of the linked columns. i.e Each player name occurs once in the Player information file but repeats regularly in the GPS/HR data
A common area looked at in many team sports is what percentage of max velocity a player hit on a given day. By using PowerPivot in this manner, we can create a table which shows this. This involves a few steps:
So why did we we do this? Well I’ll quickly show you now but go into more detail over the coming days.
- First we need to bring the Max Velocity into the GPS data by creating a new column and relating it to the Max Velocity column from the Player Information file
- Select an empty column on the far right, then input the formula below with your own data
- Personal Vmax := RELATED(PlayerDetails[Max Velocity m/s])
- In the above formula: PlayerDetails is the table name and Max Velocity m/s the column name, RELATED is the function we are using.
- Due to the Player Name connection we created earlier, it correctly assigns each players max velocity.
- Personal Vmax := RELATED(PlayerDetails[Max Velocity m/s])
- Now we go to the create Pivot Table option at the top of the PowerPivot window
- Now it’s your turn to see if you can create the Pivot Table below showing daily max velocities and personal max velocities!
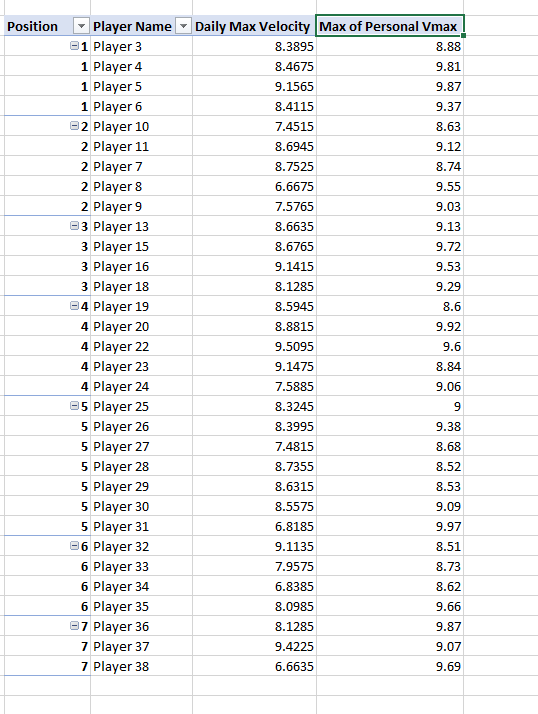
Next time we will go through another piece of the velocity puzzle, how can we show the percentage?
