

To date we have covered some initial considerations when designing an athlete wellness system along with the basic steps around how google forms can be used to collect this information. Now we will cover how googlesheets can be used to store this information and then analysed through a combination of R and PowerBI, with this article covering the initial work in R and the next covering how this can be utilised in PowerBI.
Creating Googlesheet
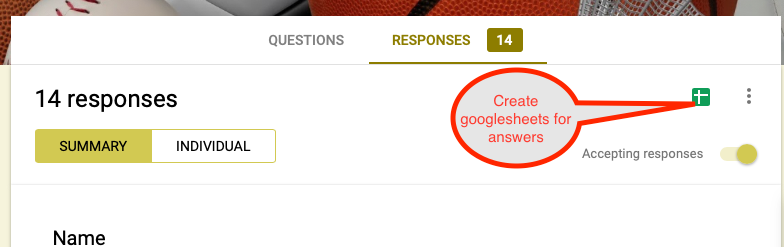
In order to have created the form in googleforms you must have a google account, we will use this account to create a spreadsheet in googlesheets to store the data. Creating this spreadsheet is really simple, on the page for your googleform, there is a tab for responses where you can view basic data around your responses. On the top right of this tab, there is a small green square which let’s you set up the googlesheets page to store your responses.
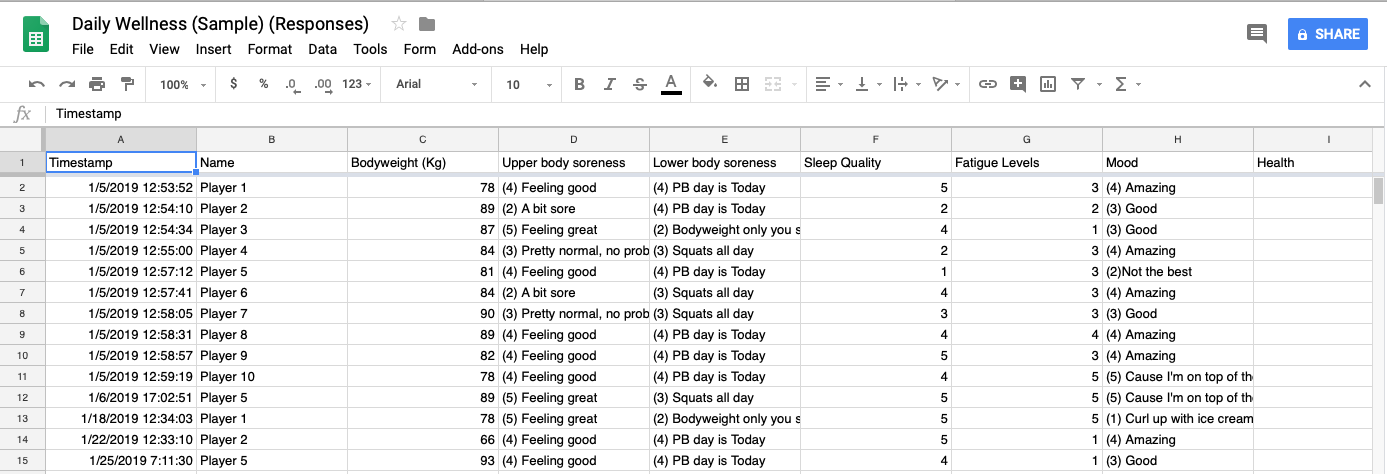
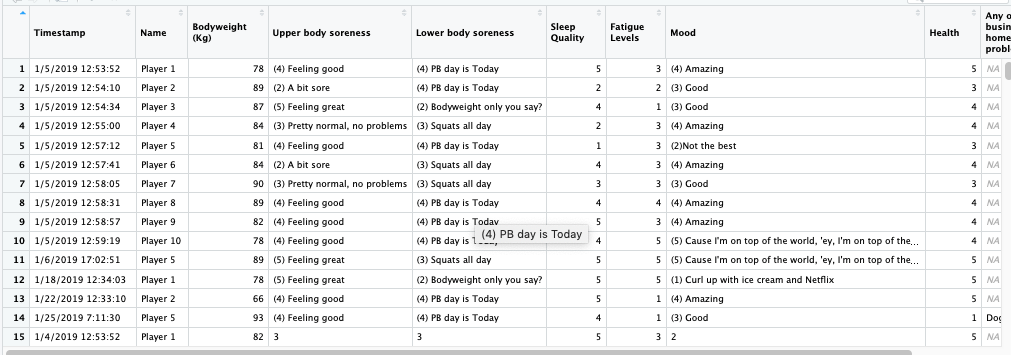
Now you should have a googlesheets with all your responses available to view.
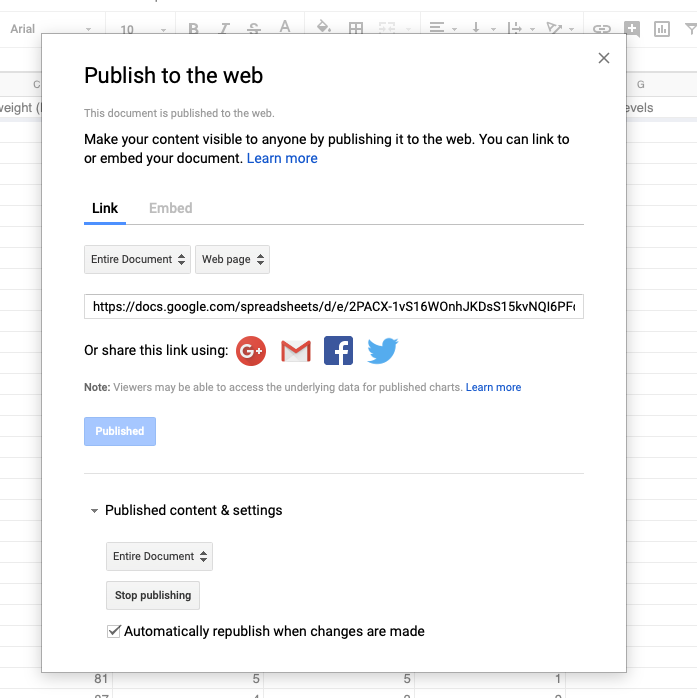
Next we connect this sheet to R, but first we have to make the sheet available by publishing the file to web (Note this does not give people without authorisation access) by the following:
- Select File
- Select Publish To The Web
- Select Publish
- You can now share the link to this page online if desired.
Linking To R
In order to connect googlesheets to R, you must have the package called googlesheetsinstalled which lets us access data stored on googlesheets. There are a few steps involved in accessing the data on googlesheets.
- Allow access to googlesheets account:
gs_auth(new_user = TRUE)- This will switch to a browser window and let you select the account you wish to access
- View the googlesheets you have access to from R
sheets <- gs_ls(new)- This creates a data frame with info about the various available sheets which we will use to access them
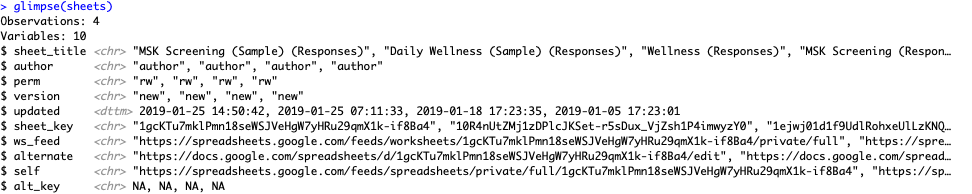
As an aside, note the use of tibble::glimpse() to take a quick look at the data above as opposed to base::str() which you can see below. glimpse is a much neater and accessible manner in which to view your data quickly

Next we must decide which sheet we wish to access. We do so by selecting the correct authorisation key from the sheet_key column within the sheets data frame. The first column indicates which sheet it is referring to so the easiest way is to create a value based on the sheet key and use that.
- In my case, it is the second sheet I wish to access so my script is:
key <- sheets$sheet_key[2]- Change the reference number as required to access your desired sheet
- Once we have the correct key, we use
gs_keyalong withgs_readto create the dataframeWellness <- gs_key(key) %>% gs_read(.)gs_keyaccesses the sheet but creates a list of datasets whilegs_readthen pulls them into a dataframe.- Note the dot
(.)withings_readis referencing the result ofgs_key(key)
Transforming Data
We can see that some work is needed before we can analyse the data within this dataframe:
- Timestamp is in datetime format, we generally only need date
- Some metrics are a combination of text and numeric
- Perhaps we want to create some rolling values or some Z-score the data to look at trends or create comparison data (See here for info on z-scores)
As mentioned previously, dates can be messy to deal with at times and this is no exception! The following will look at the timestamp column and create a date column from it:
Date = as.Date(as.POSIXct(Timestamp, format="%m/%d/%Y %H:%M:%S",tz=Sys.timezone()))- There’s a few things happening here so lets break it up a bit
as.POSIXct- If you run
glimpse(Wellness)you will see that the timestamp variable has read as a character so we must turn it into a datetime format. Here we set the format for the date time and the timezone by using the timezone set on your computer
- If you run
as.Date()- Extracts the date only from the newly created datetime variable
- We then create a new variable called
Datefrom the resulting data
Next we must look at the metrics which are a combination of text and numeric data. In my situation, I had set the answers up to contain a number based off the question, so I only need to extract the number from the data. As this will have to be performed for a number of metrics, we will use dplyr::mutate_atto carry it out in a single step. If you do not have a number in the data like here, then dplyr::case_when()can be used to change text only variables to numeric as needed.
mutate_at(vars(4,5,8), funs(as.numeric(str_extract(., "[0-9]+"))))- Again we have a few steps occurring simultaneously so let’s break it down.
stringr::str_extract(., "[0-9]+")- Look at the requested variable and extracting anything that is a number
as.numeric()- Take the result of the
str_extractand make into a numeric variable
- Take the result of the
mutate_at(vars(), funs())- Mutate the variables referenced in the
varscall using the function referenced in thefunscall
- Mutate the variables referenced in the
Now we can create some rolling metrics and/or z-scores. To create rolling metrics we can use zoo:rollmean. As wellness data is generally a small dataset (i.e. under a million rows), using zoo is suitable (if we were working with a larger dataset then data.table, RcppRollor Rcpp may be a faster option). Here I will demonstrate how to create a rolling average and a z-score for a single metric, which can be replicated the desired number of times or wrapped in dplyr::mutate_at
group_by(Name) %>% mutate(UBS_RA = zoo::rollmean(Upperbodysoreness, 30, fill=0))group_by(Name)- Creates grouped dataframe so rolling average is created on an individual basis
zoo::roll mean()- Applies a rolling average to the
Upperbodysorenesscolumn. - Based on a 30 day rolling average
- Fills the initial missing data (first 29 days) with zeros
- Applies a rolling average to the
Next, in order to create a rolling z-score we will use roll::roll_scale
UBS_z =roll_scale(matrix(Upperbodysoreness), 30)- Again we will have used
group_by()before this to ensure the z-score was applied to the individual and not the group as a wholeroll::roll_scale()applies a rolling scale to a variable (also allows for exponential decay to be computed if desired). In this instance we had a 30-day rolling z-score.- Note:
roll_scale()needs a matrix input rather than dataframe somatrix()is wrapped around the variable.
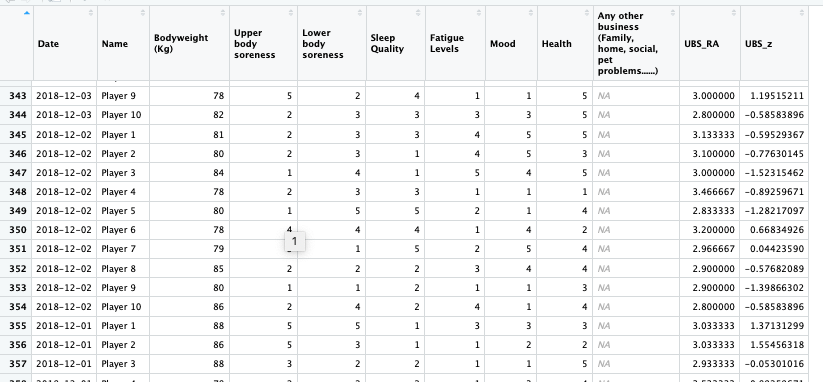
The resulting dataframe now has all our variables in desired format along with rolling averages or z-scores as required.
As we will look to integrate our R-based analysis into PowerBI, it can be worthwhile reducing the amount of R-script needed as R in PowerBI does not have the helper functions that RStudio has which can make it difficult to run at times. Today we will cover how to do this by using custom functions and then in the next blog we will see how to bring these functions into PowerBI
If we were to look to create both rolling averages and z-scores for all of the above, the script would end up along these lines:
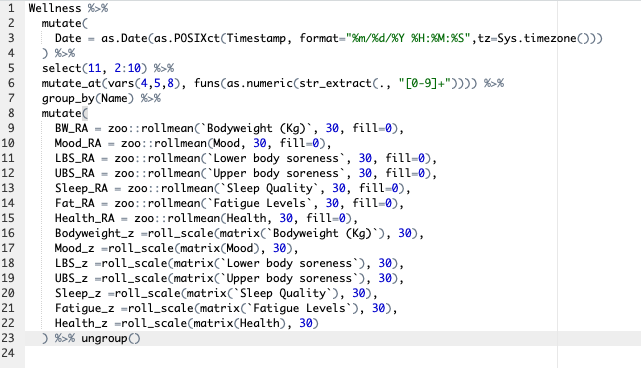
While we could look to shorten some of it through use of dplyr::mutate_at, there is still quite an amount of work being performed which in turn means more opportunity for things to go wrong! Instead we can wrap all of this in a function and bring that function into PowerBI.

Now we can read the data from googlesheets and create a dataframe that includes all wellness based metrics along with rolling averages and z-scores for further analysis in a single step. This is as far as we will go today, next time we will look at how to implement this in PowerBI
NOTE: If you are moving ahead, the above is not completely implementable in PowerBI, due to the differences in how R and PowerBI treat datetime data. See here for more info.
Version of the above script available here. (Rolling average missing)
