Skip to content

SportSciData

Data analysis solutions for sport science/S&C

  • Home
  • About Me
  • Contact Form

Month: Mar 2019

How to Create GPS Heatmaps in ggplot

Posted on 26th Mar 2019 by SportSciData

Create heat maps from GPS data using R

Posted in GPS, RStudioTagged ggplot, GPS, RLeave a comment

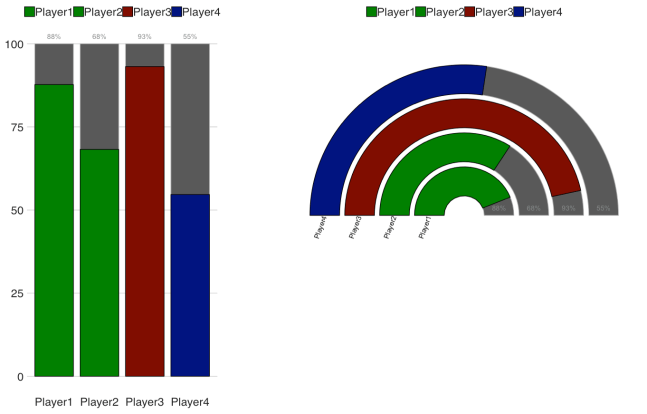
How to Create Battery and Gauge Charts in R

Posted on 6th Mar 20197th Mar 2019 by SportSciData

How to create gauge and battery plots in R

Posted in Monitoring, RStudioTagged ggplot, Load Monitoring, RLeave a comment

Follow me on Twitter

My Tweets

Previous Posts

  • Aug 2022 (6)
  • Apr 2019 (1)
  • Mar 2019 (2)
  • Feb 2019 (4)
  • Jan 2019 (4)
  • Dec 2018 (2)
  • Nov 2018 (7)
  • Oct 2018 (15)
  • Sep 2018 (12)

Tags

Advanced AMS Basic Conference Data Data Analysis Data Visualisation Excel Formulas ggplot Googlesheets GPS Guest Blog HRV Intermediate Load Monitoring Markdown Monitoring MSK MyTwoCents NewBlog PivotTables PowerBI PowerPivot PowerQuery Python Questionnaires R Report RStudio S&C Soapbox Sport Science SportScience Statistics Tableau Video Wellness

Enter your email address to subscribe to this blog and receive notifications of new posts by email.

Join 15 other subscribers.
Blog at WordPress.com.
  • Subscribe Subscribed
    • SportSciData
    • Already have a WordPress.com account? Log in now.
    • SportSciData
    • Subscribe Subscribed
    • Sign up
    • Log in
    • Report this content
    • View site in Reader
    • Manage subscriptions
    • Collapse this bar
 

Loading Comments...