Skip to content

SportSciData

Data analysis solutions for sport science/S&C

  • Home
  • About Me
  • Contact Form

Analysing and Reporting HRV Data in RMarkdown

Posted on 21st Nov 201830th Jan 2019 by SportSciData

Analysing and Reporting on HRV data using RMarkdown

Posted in General, Heart Rate, RStudioTagged HRV, Markdown, R, RStudio1 Comment

Visuals With R: Multiple Plots

Posted on 13th Nov 201830th Jan 2019 by SportSciData

Introducing facets to our plots

Posted in GPS, RStudioTagged Data Analysis, Data Visualisation, ggplot, GPS, RStudio, Sport ScienceLeave a comment

Visuals in R: Minute by Minute GPS Data

Posted on 10th Nov 201830th Jan 2019 by SportSciData

First look at how to create visuals in R

Posted in GPS, RStudioTagged Basic, Data Analysis, Data Visualisation, ggplot, GPSLeave a comment

Data in Sport Science: Artful Science or Scientific Art?

Posted on 8th Nov 201830th Jan 2019 by SportSciData

General thoughts on issues surrounding data in sport

Posted in GeneralTagged Data Analysis, MyTwoCents, S&C, Soapbox, Sport ScienceLeave a comment

Why Use R(ggplot2) to Create Graphs?

Posted on 5th Nov 201830th Jan 2019 by SportSciData

Introduction to visuals in R (and ggplot)

Posted in GPS, RStudioTagged ggplot, GPS, Intermediate, RStudio, Sport ScienceLeave a comment

How To Produce Minute By Minute Data From 10Hz Data: Rolling Averages

Posted on 2nd Nov 201830th Jan 2019 by SportSciData

Adding rolling average data to our raw data analysis

Posted in GPS, RStudioTagged Data Analysis, GPS, Intermediate, RStudio, Sport ScienceLeave a comment

How To Produce Minute By Minute Data From 10Hz Data – Multiple Files

Posted on 29th Oct 201830th Jan 2019 by SportSciData

Building in the previous post, here we cover analysing multiple files together.

Posted in GPS, RStudioTagged Advanced, Data Analysis, GPS, RStudio, Sport ScienceLeave a comment

How To Produce Minute By Minute Data From 10Hz Data

Posted on 26th Oct 201830th Jan 2019 by SportSciData

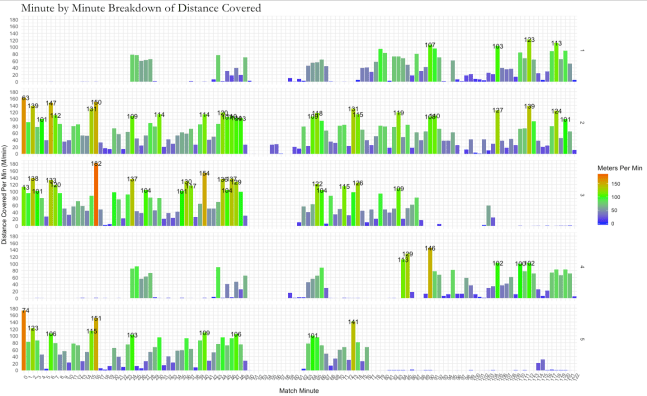
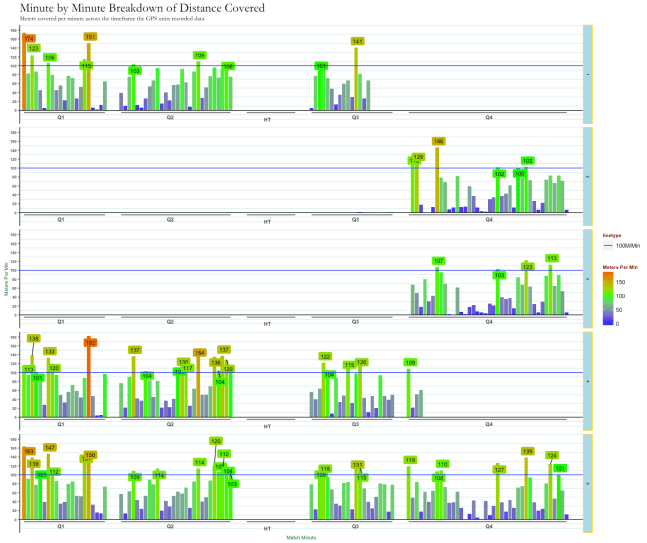
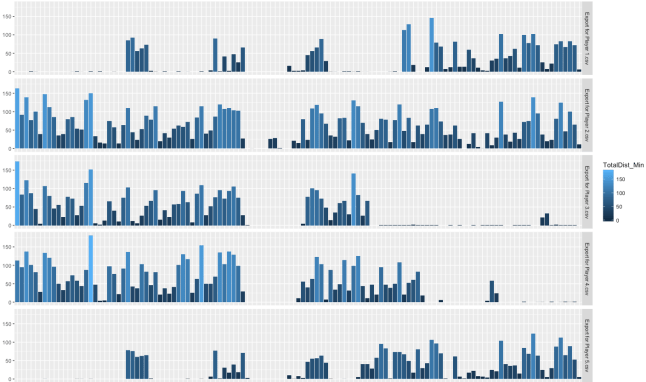
Basic manipulation of 10Htz GPS data to produce a minute by minute breakdown of a session.

Posted in GPS, RStudioTagged Data Analysis, GPS, Intermediate, RStudio, Sport Science1 Comment

Our Next Steps in Velocity Analysis in R

Posted on 22nd Oct 2018 by SportSciData

Creating days since max velocity and colour coding

Posted in ExcelLeave a comment

Introducing R For Sport Science Data Analysis: Velocity Data

Posted on 16th Oct 201830th Jan 2019 by SportSciData

How to merge data-sets and filter GPS data to begin looking at Velocity data

Posted in GPS, RStudioTagged Data Analysis, GPS, Intermediate, RStudioLeave a comment

Posts navigation

← Older posts
Newer posts →

Follow me on Twitter

My Tweets

Previous Posts

  • Aug 2022 (6)
  • Apr 2019 (1)
  • Mar 2019 (2)
  • Feb 2019 (4)
  • Jan 2019 (4)
  • Dec 2018 (2)
  • Nov 2018 (7)
  • Oct 2018 (15)
  • Sep 2018 (12)

Tags

Advanced AMS Basic Conference Data Data Analysis Data Visualisation Excel Formulas ggplot Googlesheets GPS Guest Blog HRV Intermediate Load Monitoring Markdown Monitoring MSK MyTwoCents NewBlog PivotTables PowerBI PowerPivot PowerQuery Python Questionnaires R Report RStudio S&C Soapbox SportScience Sport Science Statistics Tableau Video Wellness

Enter your email address to subscribe to this blog and receive notifications of new posts by email.

Join 3,015 other subscribers.
Blog at WordPress.com.
Privacy & Cookies: This site uses cookies. By continuing to use this website, you agree to their use.
To find out more, including how to control cookies, see here: Cookie Policy
  • Follow Following
    • SportSciData
    • Already have a WordPress.com account? Log in now.
    • SportSciData
    • Customise
    • Follow Following
    • Sign up
    • Log in
    • Report this content
    • View site in Reader
    • Manage subscriptions
    • Collapse this bar
 

Loading Comments...